Dashboards
Data collection dashboards with tabular and graphical forms are available for Sentinel and Landsat data:
- Sentinel: https://monitoring.terrabyte.lrz.de/grafana/public-dashboards/e28bdc4ecbec4cf193411c47dc453e66?orgId=1
- Landsat: https://monitoring.terrabyte.lrz.de/grafana/public-dashboards/027a1ab0666646e0b0b5420e21f9fa1d?orgId=1
Overview
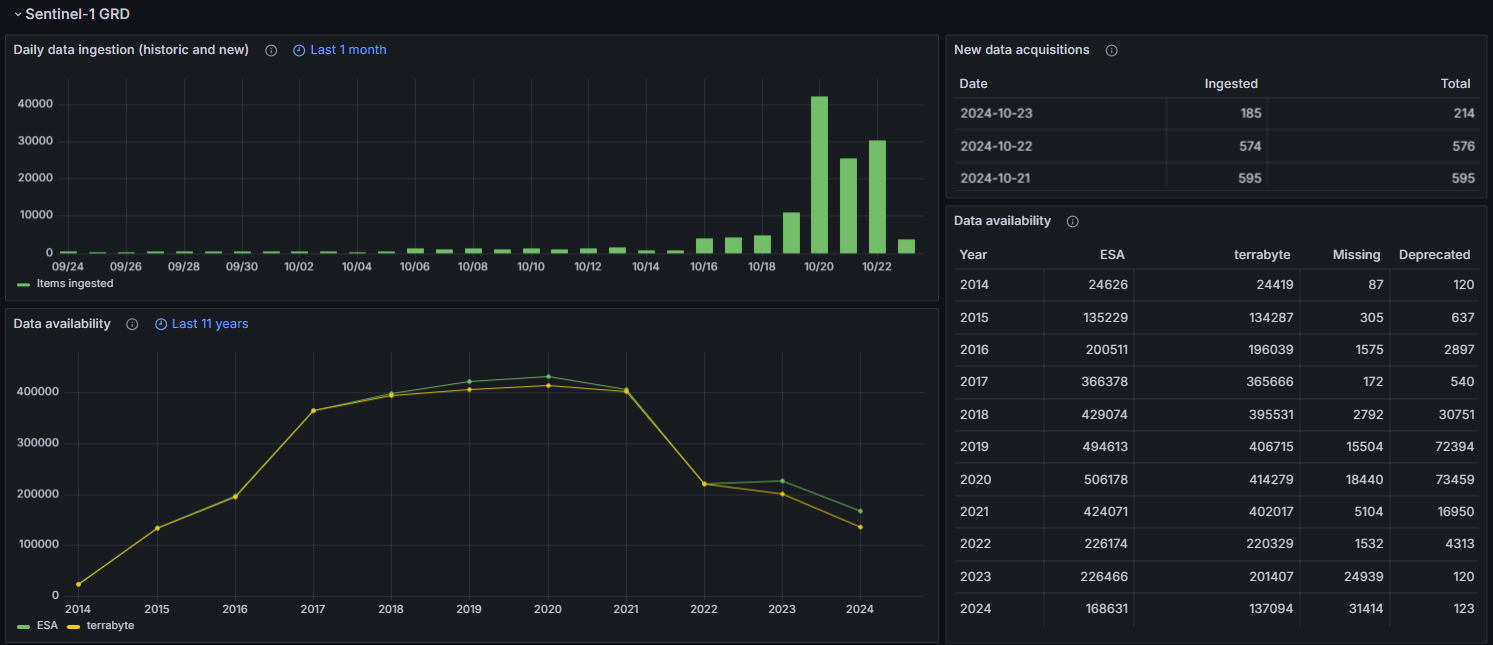
 Exemplary screenshot from 2024-10-23.
Inventory Statistics
Daily data ingestion (historic and new): Daily number of scenes ingested successfully into terrabyte. The number includes new acquisitions as well as the completion of the archive. Only the numbers of the last 30 days are shown here. This graph is updated daily.
New data acquisitions: Daily number of new data acquisitions totally available and ingested into terrabyte of the last 7 days. This graph is updated hourly.
Yearly data availability: Yearly number of scenes totally available (e.g., columns ESA and USGS) and ingested into terrabyte (column terrabyte). The table shows also Missing scenes on terrabyte (still to be ingested) and Deprecated scenes. Deprecated scenes are still available on the data provider's archive but will not be ingested into terrabyte as they have been replaced by newer updated scenes. This numbers are updated monthly.
 Exemplary screenshot from 2024-10-23.
Inventory Maps
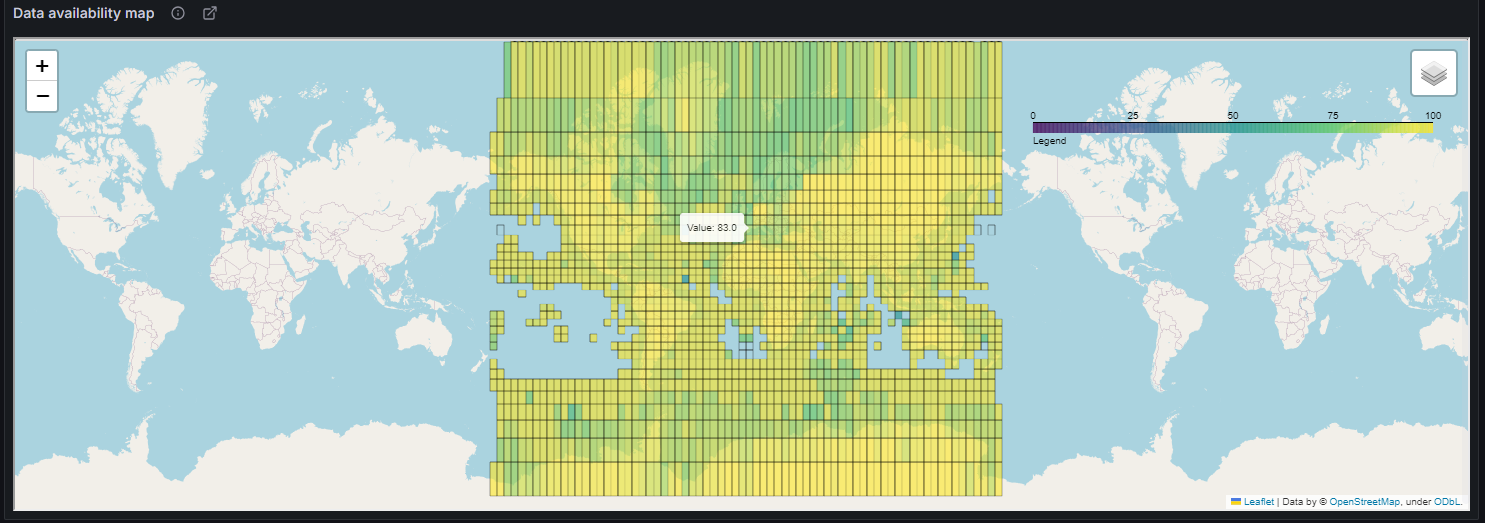
The interactive inventory maps show the spatial distribution of data availability in percent [0-100] (comparison terrabyte with the data provider). You can interactively zoom and show the availability for each grid cell. The map is updated monthly.
With the link icon in the title you can open the map as fullscreen in a new browser window.
 Exemplary screenshot from 2024-10-23.